Reports
A report combines one or more data insights into a single overview. You can export a report and use it as the basis for regular mail digests.
Find reports in Analytics & reports → Reports → Reports.
Creating a report
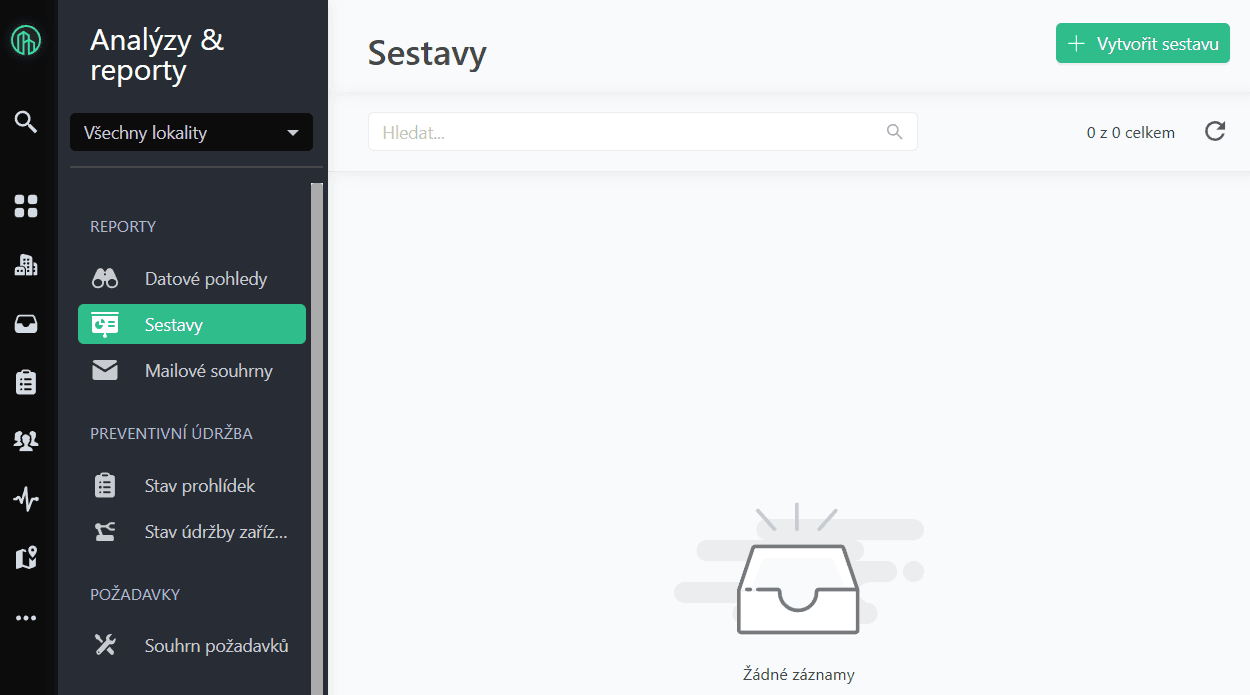
Open Analytics & reports → Reports and click the green + Create report button.
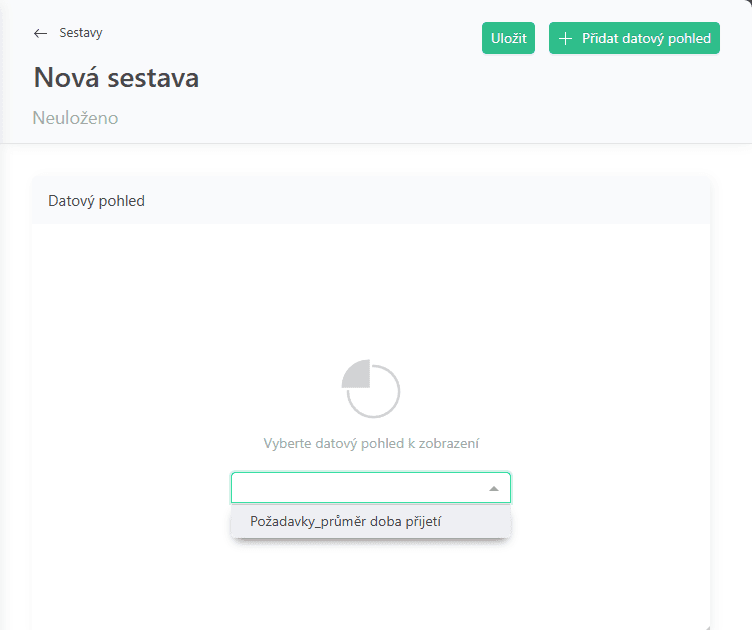
Click + Add data insight and select the view you want to display from the dropdown.
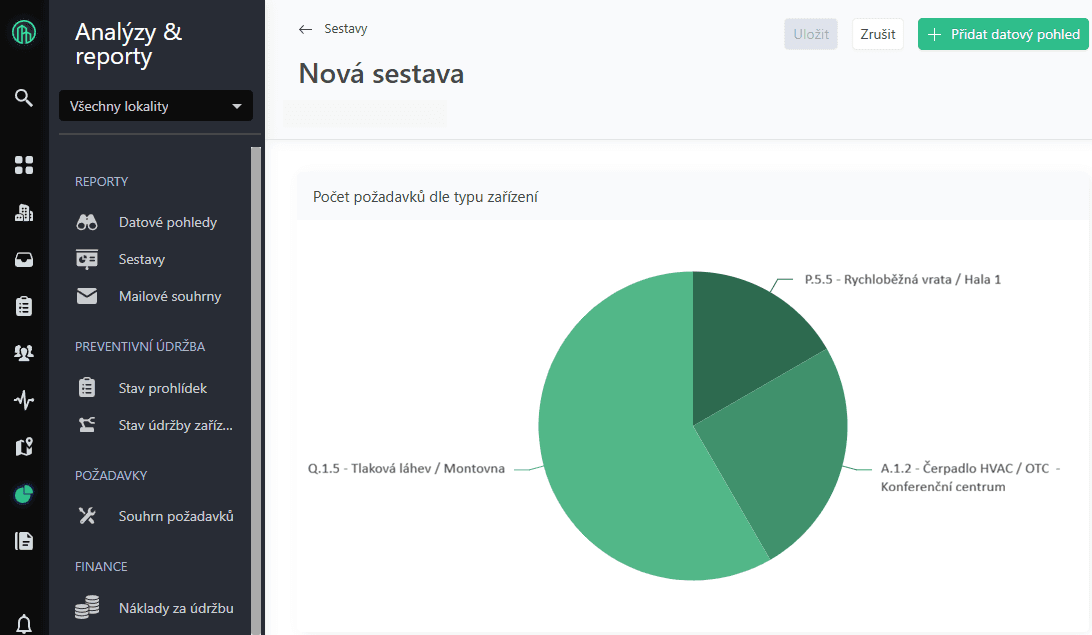
To add another widget, choose + Add data insight. Enter a name for the report and confirm with "Save".
Widget settings
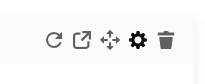
Hover over the upper-right corner of a widget to edit it. You can:
- refresh data
- open the linked data insight
- adjust position and size
- change settings
- remove the widget
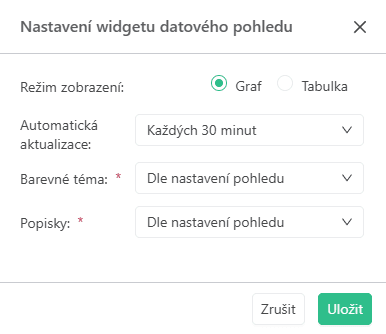
In the data insight widget settings, you can choose whether the report shows a chart or a table. You can also set how often data is refreshed automatically. You can adjust the color theme and label display (note: when exporting a report to Excel or PDF, display follows the original settings in the data insight, not the report).
Exporting a report
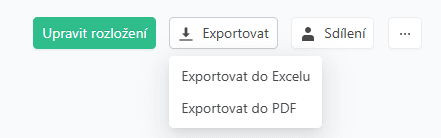
The "Export" button offers export to Excel or PDF.
Sharing a report
Sharing a report works like sharing a data insight and lets you make the report visible to other users. Permissions for reports and data visibility follow the same rules as for data insights; see Shared data insights.
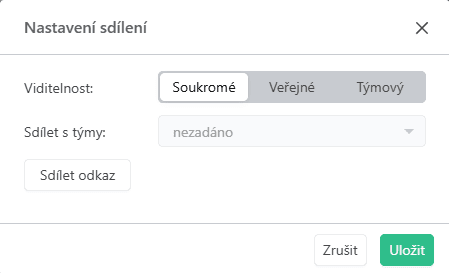
- Private – only the owner can see the report.
- Public – all users with permission to view reports can see it. Data visibility is still limited by each user's permissions (see Shared data insights).
- Team – only members of the selected teams, the report administrator, and the owner can see it. Data visibility is still limited by each user's permissions (see Shared data insights).
Confirm sharing settings with "Save".